Gun Death Statistics and Rates in the United States (Homicides, Suicides, and Accidents)
Each year tens of thousands of firearm-related deaths occur in the United States. Below, we will take a closer look at gun death statistics, including homicides, suicides, and accidents.
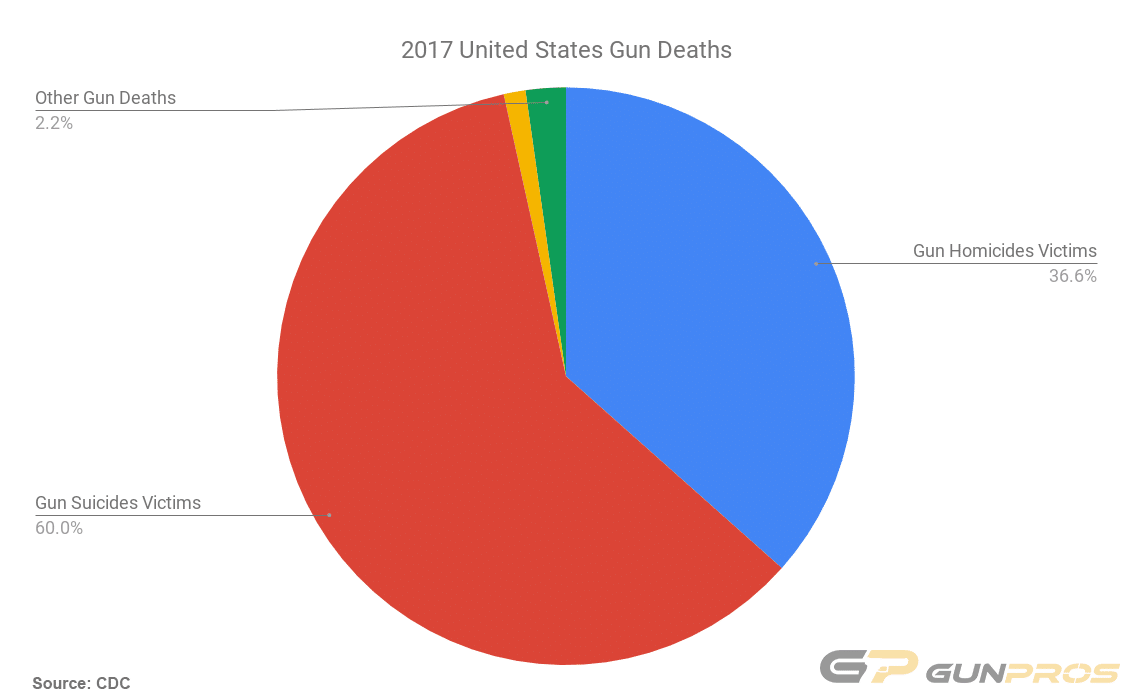
2017 Gun Deaths
The most recent year that the Centers for Disease Control and Prevention (CDC) has published a complete "National Vital Statistics Report" is 2017.
There were 39,773 firearm-related deaths. 14,542 (36.56%) of the deaths were the result of homicides, 23,854 (59.98%) were suicides, and 486 (1.22%) were the result of accidents. The remaining 891 deaths were not attributed to any of these three causes.
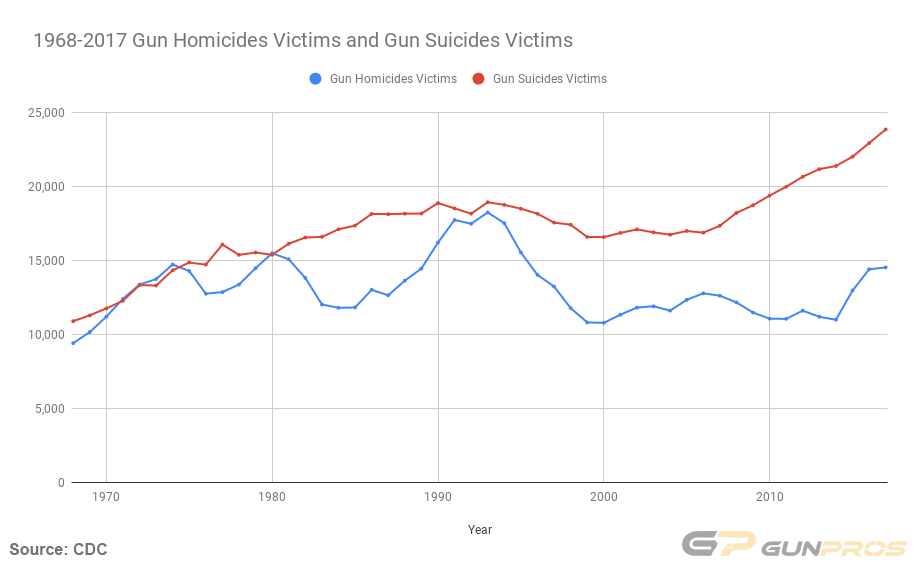
United States Firearm Homicide Victims and Firearm Suicide Victims 1968-2017
According to data from the CDC, gun deaths as a result of suicide generally outnumber gun deaths from homicides year to year. This has continuously been the case from 1981 to 2017.
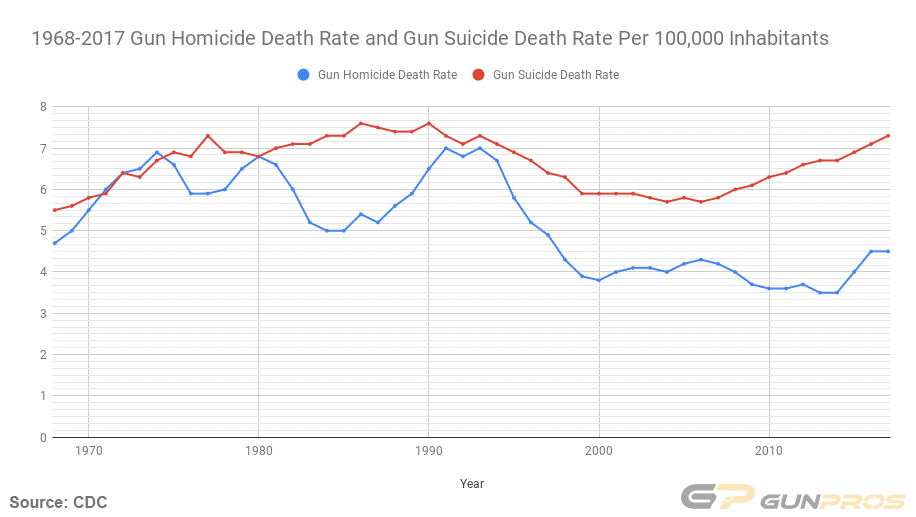
United States Firearm Homicide Gun Death Rate and Firearm Suicide Gun Death Rate 1968-2017
Since the population in the United States has continuously been on the rise, gun death rates are a better way to compare the prevalence of gun deaths over the years. The chart below shows the gun homicide death rate and gun suicide death rate per 100,000 inhabitants from 1968-2017.
Gun Homicide Death Rates Statistics
When the CDC began tracking gun homicide death rates in 1968, the rate was 4.7 deaths per 100,000 inhabitants. By 1974, the death rate reached 6.9 per 100,000. After getting as low as 5.9 in 1976 and 1977, the homicide by firearm rate again spiked to 6.8 in 1980.
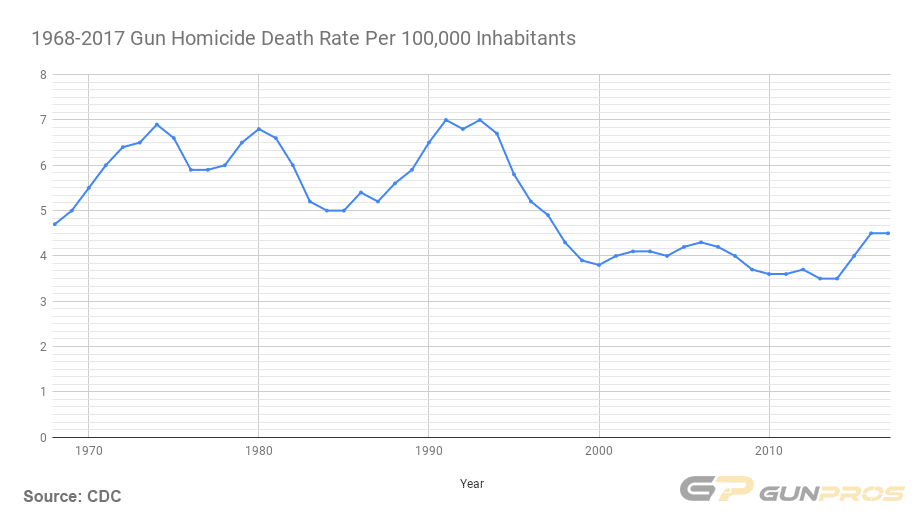
From this point, the firearm homicide rate trended downward for a few years, reaching as low as 5.0 deaths per 100,000 in 1984 and 1985. Firearm homicide deaths rates began rising again soon after, reaching a peak of 7.0 in 1991 and 1993.
Since the early 1990s, firearm homicide death rates have generally been on a downward trend, reaching their lowest point in 2013 and 2014 at 3.5 deaths per 100,000 inhabitants.
2016 and 2017 had homicide death rates at 4.5 per 100,000 inhabitants, for the highest firearm homicide death rates since 1997.
Gun Suicide Death Rates Statistics
Firearm suicide death rates rose to peaks of 7.6 per 100,000 inhabitants in 1986 and 1990. While gun suicide death rates were trending downward, to as low as 5.7 in 2004 and 2006, they have since been steadily on the rise. 2017 saw a firearm suicide rate of 7.3 deaths per 100,000 inhabitants.
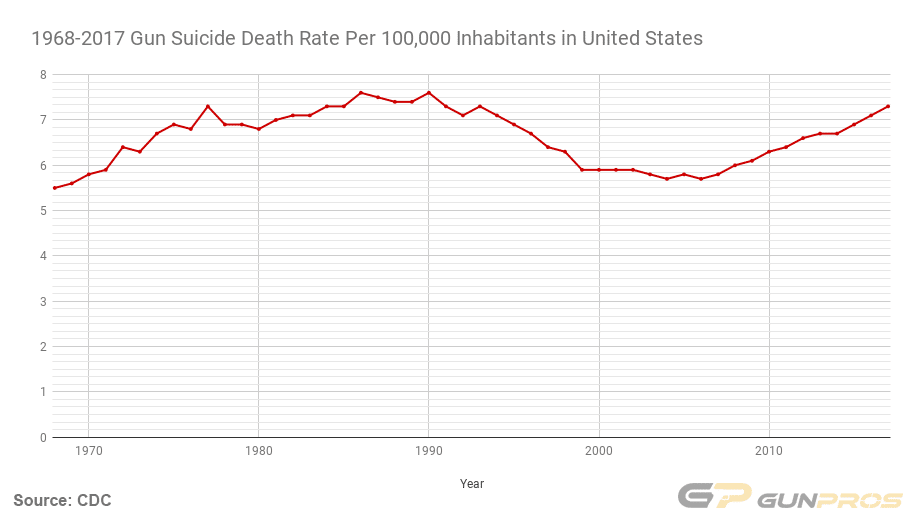
Firearm Homicide and Suicide Death Statistics in the United States From 1986-2017
The table below shows the raw data for gun homicide deaths, gun homicide death rates, gun suicide deaths, and gun suicide death rates obtained from the CDC [Sources 1, 2, 3].
| Year | Gun Homicides Deaths | Gun Homicide Death Rate Per 100,000 | Gun Suicides Deaths | Gun Suicide Death Rate Per 100,000 |
|---|---|---|---|---|
| 1968 | 9,425 | 4.7 | 10,911 | 5.5 |
| 1969 | 10,174 | 5 | 11,304 | 5.6 |
| 1970 | 11,213 | 5.5 | 11,772 | 5.8 |
| 1971 | 12,423 | 6 | 12,288 | 5.9 |
| 1972 | 13,382 | 6.4 | 13,348 | 6.4 |
| 1973 | 13,752 | 6.5 | 13,317 | 6.3 |
| 1974 | 14,737 | 6.9 | 14,345 | 6.7 |
| 1975 | 14,295 | 6.6 | 14,873 | 6.9 |
| 1976 | 12,766 | 5.9 | 14,728 | 6.8 |
| 1977 | 12,874 | 5.9 | 16,084 | 7.3 |
| 1978 | 13,386 | 6 | 15,387 | 6.9 |
| 1979 | 14,491 | 6.5 | 15,543 | 6.9 |
| 1980 | 15,500 | 6.8 | 15,396 | 6.8 |
| 1981 | 15,089 | 6.6 | 16,139 | 7 |
| 1982 | 13,830 | 6 | 16,560 | 7.1 |
| 1983 | 12,040 | 5.2 | 16,600 | 7.1 |
| 1984 | 11,815 | 5 | 17,113 | 7.3 |
| 1985 | 11,836 | 5 | 17,363 | 7.3 |
| 1986 | 13,029 | 5.4 | 18,153 | 7.6 |
| 1987 | 12,657 | 5.2 | 18,136 | 7.5 |
| 1988 | 13,645 | 5.6 | 18,169 | 7.4 |
| 1989 | 14,464 | 5.9 | 18,178 | 7.4 |
| 1990 | 16,218 | 6.5 | 18,885 | 7.6 |
| 1991 | 17,746 | 7 | 18,526 | 7.3 |
| 1992 | 17,488 | 6.8 | 18,169 | 7.1 |
| 1993 | 18,253 | 7 | 18,940 | 7.3 |
| 1994 | 17,527 | 6.7 | 18,765 | 7.1 |
| 1995 | 15,551 | 5.8 | 18,503 | 6.9 |
| 1996 | 14,037 | 5.2 | 18,166 | 6.7 |
| 1997 | 13,252 | 4.9 | 17,566 | 6.4 |
| 1998 | 11,798 | 4.3 | 17,424 | 6.3 |
| 1999 | 10,828 | 3.9 | 16,599 | 5.9 |
| 2000 | 10,801 | 3.8 | 16,586 | 5.9 |
| 2001 | 11,348 | 4 | 16,869 | 5.9 |
| 2002 | 11,829 | 4.1 | 17,108 | 5.9 |
| 2003 | 11,920 | 4.1 | 16,907 | 5.8 |
| 2004 | 11,624 | 4 | 16,750 | 5.7 |
| 2005 | 12,352 | 4.2 | 17,002 | 5.8 |
| 2006 | 12,791 | 4.3 | 16,883 | 5.7 |
| 2007 | 12,632 | 4.2 | 17,352 | 5.8 |
| 2008 | 12,179 | 4 | 18,223 | 6 |
| 2009 | 11,493 | 3.7 | 18,735 | 6.1 |
| 2010 | 11,078 | 3.6 | 19,392 | 6.3 |
| 2011 | 11,068 | 3.6 | 19,990 | 6.4 |
| 2012 | 11,622 | 3.7 | 20,666 | 6.6 |
| 2013 | 11,208 | 3.5 | 21,175 | 6.7 |
| 2014 | 11,008 | 3.5 | 21,386 | 6.7 |
| 2015 | 12,979 | 4 | 22,018 | 6.9 |
| 2016 | 14,415 | 4.5 | 22,938 | 7.1 |
| 2017 | 14,542 | 4.5 | 23,854 | 7.3 |
United States Gun Homicide Deaths and All Homicide Deaths 1986-2017
The following chart shows gun homicide deaths and all homicide deaths (including gun homicide deaths) from 1986-2017.
Data Source: CDC
Here is a look at the gun homicide death rate per 100,000 inhabitants and all the death rate of all homicides per 100,000 (including gun homicide deaths) in the United States from 1986-2017.
Data Source: CDC
United States Gun Suicide Deaths and All Suicide Deaths 1986-2017
This chart shows gun suicide deaths and all suicide deaths (including gun suicide deaths) in the United States from 1986-2017.
Data Source: CDC
Here is the gun suicide death rate per 100,000 inhabitants and the death rate attributed to all suicides per 100,000 in the United States from 1986-2017.
Data Source: CDC
Accidental Firearm Deaths and Accidental Firearm Death Rates in the United States 1999-2017
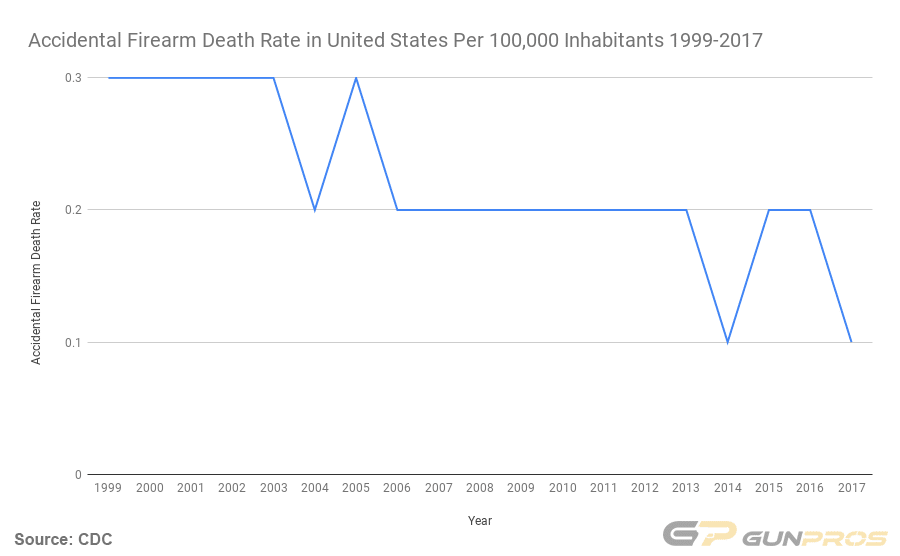
The CDC began tracking accidental firearm deaths in 1999.
Fortunately, accidental firearm deaths have been on a steady downward trend since then.
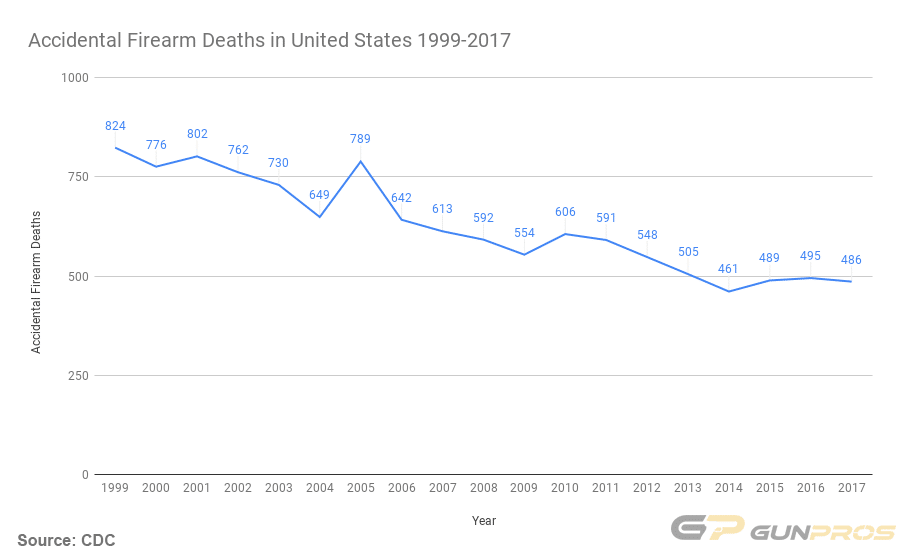
This chart shows accidental firearm death rates per 100,000 inhabitants from 1999-2017.
All Raw Data
This table shows all the raw data gathered for this research report from the CDC.
| Year | Gun Homicides Deaths | Gun Homicide Death Rate | Gun Suicides Deaths | Gun Suicide Death Rate | Accidental Gun Deaths | Accidental Gun Death Rate | All Homicide Deaths | All Homicide Death Rate | All Suicide Deaths | All Suicide Death Rate |
|---|---|---|---|---|---|---|---|---|---|---|
| 1968 | 9,425 | 4.7 | 10,911 | 5.5 | 14,686 | 7.4 | 21,372 | 10.7 | ||
| 1969 | 10,174 | 5 | 11,304 | 5.6 | 15,477 | 7.7 | 22,364 | 11.1 | ||
| 1970 | 11,213 | 5.5 | 11,772 | 5.8 | 16,848 | 8.3 | 23,480 | 11.5 | ||
| 1971 | 12,423 | 6 | 12,288 | 5.9 | 18,787 | 9.1 | 24,092 | 11.7 | ||
| 1972 | 13,382 | 6.4 | 13,348 | 6.4 | 19,638 | 9.4 | 25,004 | 12 | ||
| 1973 | 13,752 | 6.5 | 13,317 | 6.3 | 20,465 | 9.7 | 25,118 | 11.9 | ||
| 1974 | 14,737 | 6.9 | 14,345 | 6.7 | 21,465 | 10.1 | 25,683 | 12 | ||
| 1975 | 14,295 | 6.6 | 14,873 | 6.9 | 21,310 | 9.9 | 27,063 | 12.6 | ||
| 1976 | 12,766 | 5.9 | 14,728 | 6.8 | 19,554 | 9 | 26,832 | 12.3 | ||
| 1977 | 12,874 | 5.9 | 16,084 | 7.3 | 19,968 | 9.1 | 28,681 | 13 | ||
| 1978 | 13,386 | 6 | 15,387 | 6.9 | 20,432 | 9.2 | 27,294 | 12.3 | ||
| 1979 | 14,491 | 6.5 | 15,543 | 6.9 | 22,202 | 9.9 | 27,206 | 12.1 | ||
| 1980 | 15,500 | 6.8 | 15,396 | 6.8 | 23,967 | 10.6 | 26,869 | 11.9 | ||
| 1981 | 15,089 | 6.6 | 16,139 | 7 | 23,361 | 10.2 | 27,596 | 12 | ||
| 1982 | 13,830 | 6 | 16,560 | 7.1 | 22,073 | 9.5 | 28,242 | 12.2 | ||
| 1983 | 12,040 | 5.2 | 16,600 | 7.1 | 19,922 | 8.5 | 28,295 | 12.1 | ||
| 1984 | 11,815 | 5 | 17,113 | 7.3 | 19,510 | 8.3 | 29,268 | 12.4 | ||
| 1985 | 11,836 | 5 | 17,363 | 7.3 | 19,628 | 8.2 | 29,453 | 12.4 | ||
| 1986 | 13,029 | 5.4 | 18,153 | 7.6 | 21,462 | 8.9 | 30,904 | 12.9 | ||
| 1987 | 12,657 | 5.2 | 18,136 | 7.5 | 20,812 | 8.6 | 30,796 | 12.7 | ||
| 1988 | 13,645 | 5.6 | 18,169 | 7.4 | 21,784 | 8.9 | 30,407 | 12.4 | ||
| 1989 | 14,464 | 5.9 | 18,178 | 7.4 | 22,578 | 9.1 | 30,232 | 12.2 | ||
| 1990 | 16,218 | 6.5 | 18,885 | 7.6 | 24,614 | 9.9 | 30,906 | 12.4 | ||
| 1991 | 17,746 | 7 | 18,526 | 7.3 | 26,254 | 10.4 | 30,810 | 12.2 | ||
| 1992 | 17,488 | 6.8 | 18,169 | 7.1 | 25,144 | 9.8 | 30,484 | 11.9 | ||
| 1993 | 18,253 | 7 | 18,940 | 7.3 | 25,653 | 9.9 | 31,102 | 12 | ||
| 1994 | 17,527 | 6.7 | 18,765 | 7.1 | 24,547 | 9.3 | 31,142 | 11.8 | ||
| 1995 | 15,551 | 5.8 | 18,503 | 6.9 | 22,552 | 8.5 | 31,284 | 11.7 | ||
| 1996 | 14,037 | 5.2 | 18,166 | 6.7 | 20,634 | 7.7 | 30,903 | 11.5 | ||
| 1997 | 13,252 | 4.9 | 17,566 | 6.4 | 19,491 | 7.1 | 30,535 | 11.2 | ||
| 1998 | 11,798 | 4.3 | 17,424 | 6.3 | 17,893 | 6.5 | 30,575 | 11.1 | ||
| 1999 | 10,828 | 3.9 | 16,599 | 5.9 | 824 | 0.3 | 16,889 | 6.1 | 29,199 | 10.5 |
| 2000 | 10,801 | 3.8 | 16,586 | 5.9 | 776 | 0.3 | 16,765 | 6 | 29,350 | 10.4 |
| 2001 | 11,348 | 4 | 16,869 | 5.9 | 802 | 0.3 | 20,308 | 7.1 | 30,622 | 10.7 |
| 2002 | 11,829 | 4.1 | 17,108 | 5.9 | 762 | 0.3 | 17,638 | 6.1 | 31,655 | 11 |
| 2003 | 11,920 | 4.1 | 16,907 | 5.8 | 730 | 0.3 | 17,732 | 6.1 | 31,484 | 10.9 |
| 2004 | 11,624 | 4 | 16,750 | 5.7 | 649 | 0.2 | 17,357 | 5.9 | 32,439 | 11.1 |
| 2005 | 12,352 | 4.2 | 17,002 | 5.8 | 789 | 0.3 | 18,124 | 6.1 | 32,637 | 11 |
| 2006 | 12,791 | 4.3 | 16,883 | 5.7 | 642 | 0.2 | 18,573 | 6.2 | 33,300 | 11.2 |
| 2007 | 12,632 | 4.2 | 17,352 | 5.8 | 613 | 0.2 | 18,361 | 6.1 | 34,598 | 11.5 |
| 2008 | 12,179 | 4 | 18,223 | 6 | 592 | 0.2 | 17,826 | 5.9 | 36,035 | 11.8 |
| 2009 | 11,493 | 3.7 | 18,735 | 6.1 | 554 | 0.2 | 16,799 | 5.5 | 36,909 | 12 |
| 2010 | 11,078 | 3.6 | 19,392 | 6.3 | 606 | 0.2 | 16,259 | 5.3 | 38,364 | 12.4 |
| 2011 | 11,068 | 3.6 | 19,990 | 6.4 | 591 | 0.2 | 16,238 | 5.2 | 39,518 | 12.7 |
| 2012 | 11,622 | 3.7 | 20,666 | 6.6 | 548 | 0.2 | 16,688 | 5.3 | 40,600 | 12.9 |
| 2013 | 11,208 | 3.5 | 21,175 | 6.7 | 505 | 0.2 | 16,121 | 5.1 | 41,149 | 13 |
| 2014 | 11,008 | 3.5 | 21,386 | 6.7 | 461 | 0.1 | 15,872 | 5 | 42,826 | 13.4 |
| 2015 | 12,979 | 4 | 22,018 | 6.9 | 489 | 0.2 | 17,793 | 5.5 | 44,193 | 13.7 |
| 2016 | 14,415 | 4.5 | 22,938 | 7.1 | 495 | 0.2 | 19,362 | 6 | 44,965 | 13.9 |
| 2017 | 14,542 | 4.5 | 23,854 | 7.3 | 486 | 0.1 | 19,510 | 6 | 47,173 | 14.5 |
Data Source
All data was gathered from the Centers for Disease Control and Prevention (CDC).
Referencing This Research
Feel free to use any images, charts, or the data we compiled for your work. However, we ask that you please reference this page if you are benefiting from any of the work we have done in compiling or presenting the data.
